Debugging Golang Applications With Visual Studio Code
The vast majority of debugging I’ve encountered recently is usually done with
printf. Debuggers are either a forgotten craft or not appealing, but the
benefits are so vast while usage is so easy that I find myself writing up a
referencable snippet on this.
The average developer in 2022 uses Visual Studio Code. I’m going to exercise how to debug golang applications based on this environment. VS Code uses the Go delve debugger, short dlv. This is just good to know but VS Code hides even this fact from you, so you can get debugging utility just from a few clicks in the UI.
Setup the development environment
Pressing F5 or Run -> Start Debugging the first time in a project will ask you
to create a launch.json file.
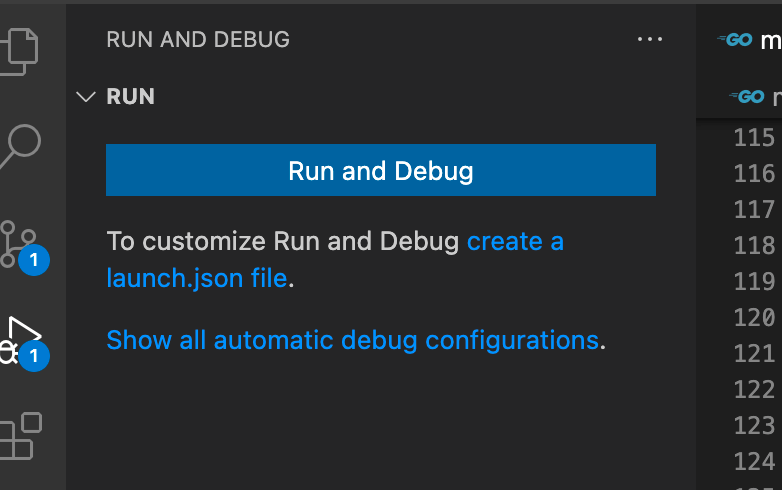
We create .vscode/launch.json:
{
    "version": "0.2.0",
    "configurations": [

        {
            "name": "Launch Package",
            "type": "go",
            "request": "launch",
            "mode": "auto",
            "showLog": true,
            "program": "${workspaceFolder}",
        }
    ]
}
If our project uses dotenv (a .env file with environment variables) abiding
the 12 factor app
methodology,
you can inform VS Code to source these variables into the debug environment by adding:
{
    // ...
    "configurations": [
        {
            // ...
            "envFile": "${workspaceFolder}/.env"
        }
    ]
}
Your dotenv file probably looks something like this:
SERVICE_ADDRESS=:8082
CLUSTER_RPC_URL=http://localhost:8899
CLUSTER_WEBSOCKET_URL=ws://localhost:8900
# ...
If the application requires command line arguments, such as for example sqliteviz, add them like so:
{
    // ...
    "configurations": [
        {
            // ...
            "args": ["-db", "chinook.db", "-ignore", "schema_migrations,sqlite_stat1"]
        }
    ]
}
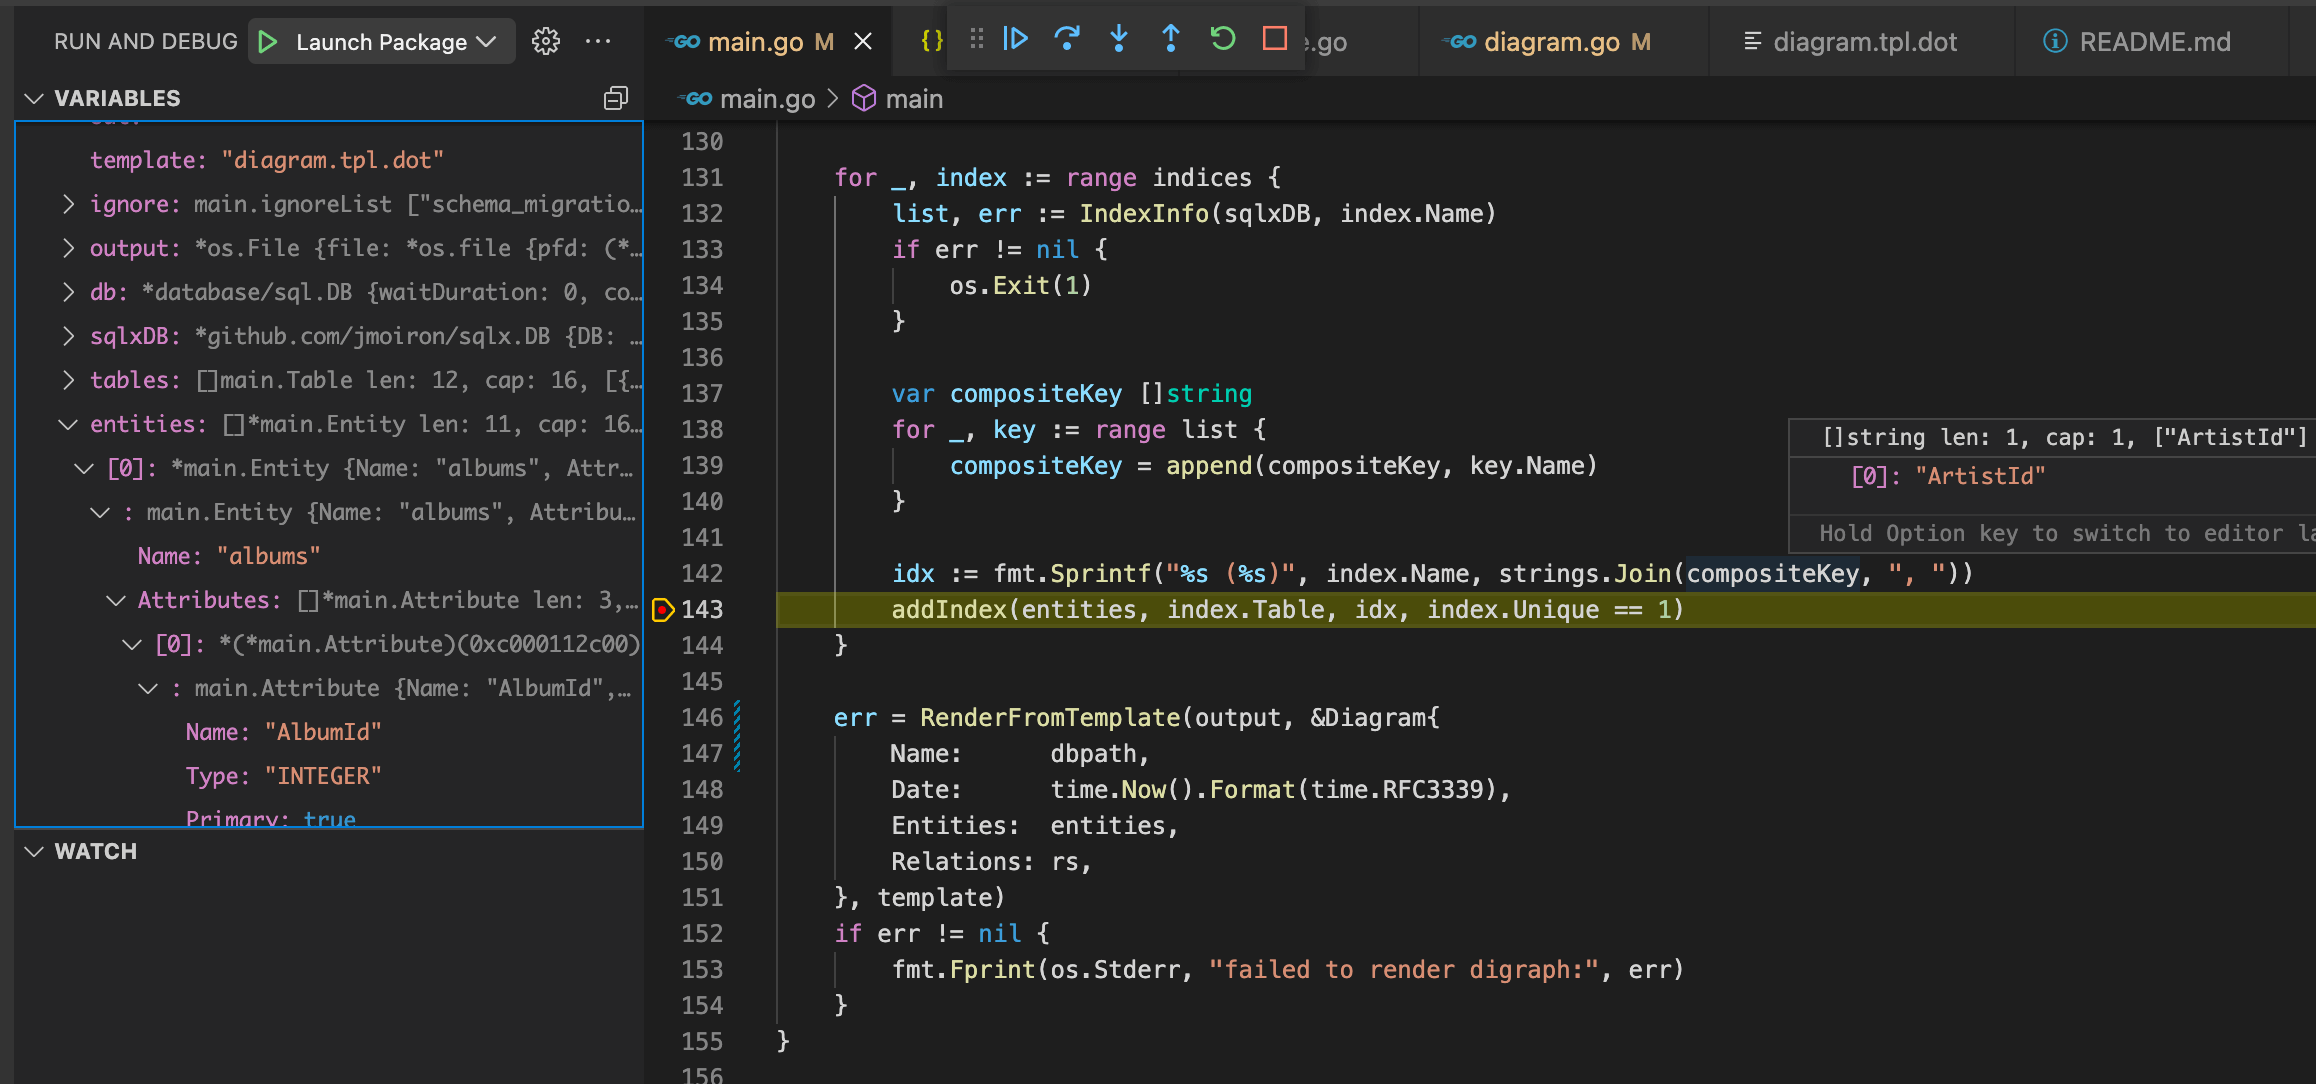
Setting breakpoints
Set a breakpoint and run the app in mode “test” or “auto” mode and wait for your breakpoint to hit and while the program is paused, we have a full view of stack variables available:
Should your app segfault, you will get interactive call stacks:
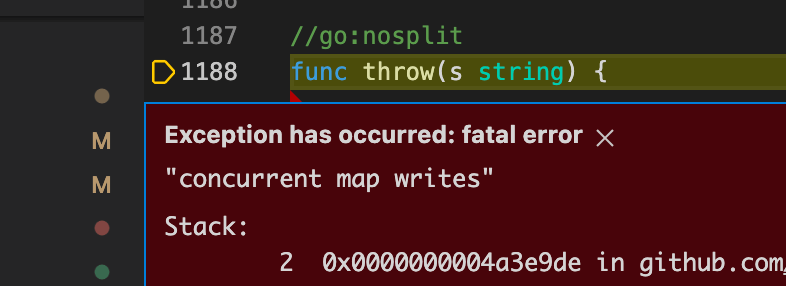
If the application deadlocks, we can see where we try to acquire a semaphore and the call stack leading up to the deadlock.
It’s that easy. For a deeper dive see golang/vscode-go/docs/debugging.md.
Last modified on Thursday, May 12, 2022.
Go back