Profiling Golang with pprof
This is a brief reference on how to use Go tool pprof, the long version can be found on the Go blog.
To use pprof, link this package into your program:
import _ "net/http/pprof"
This can be included conditionally during build.
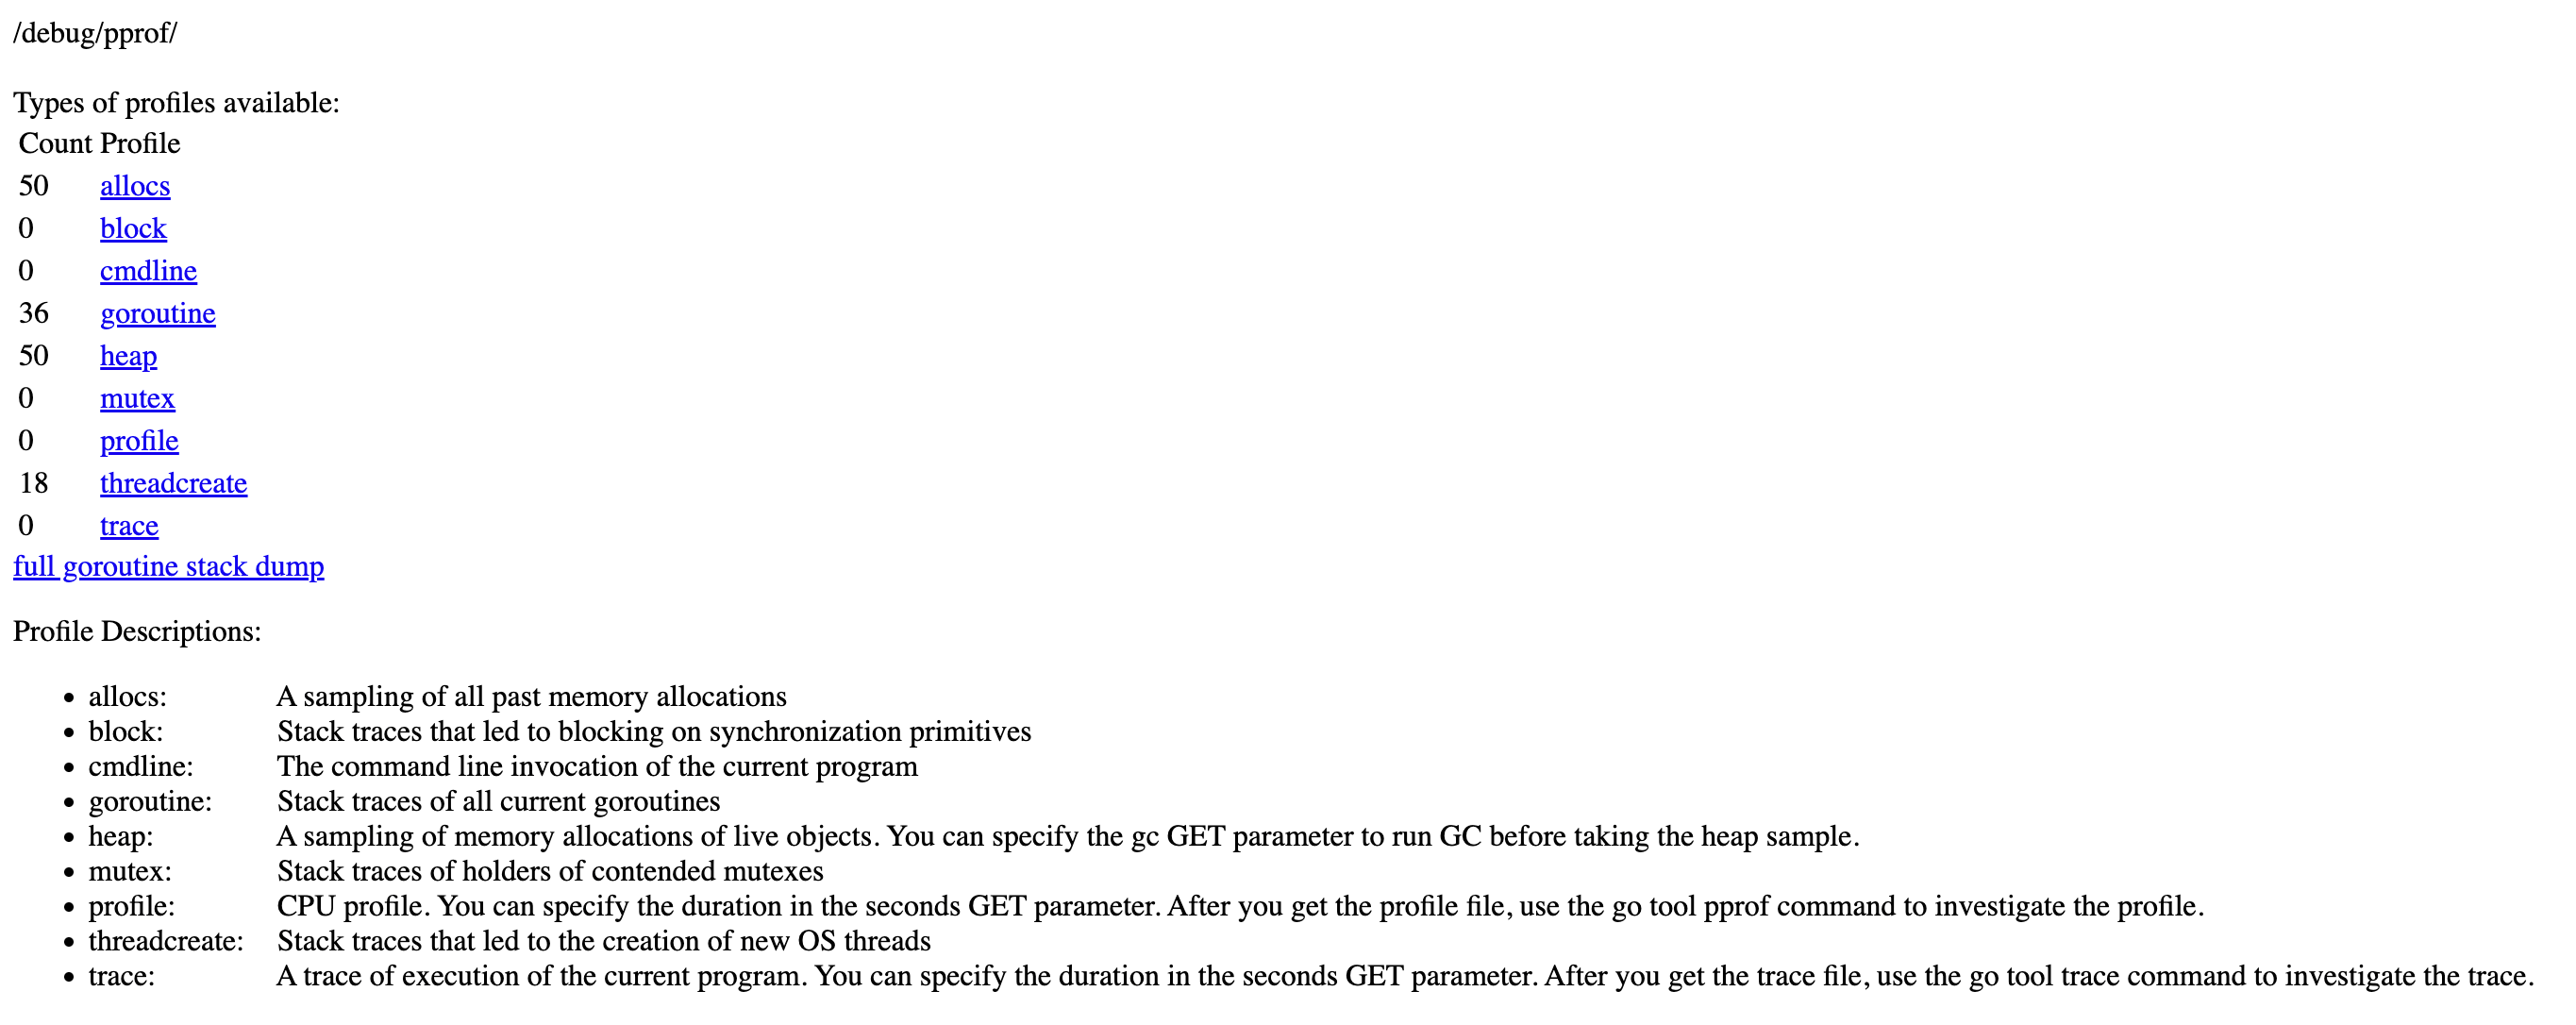
If your application is not already running an http server, you need to start one. To view all available profiles, open http://localhost:8080/debug/pprof/ in your browser (use the port of your webserver).
We can connect the go tool pprof program to the web interface at host:port,
e.g.:
go tool pprof http://localhost:8082/debug/pprof/goroutine
This puts us into an interactive mode where we run the top command
(pprof) top
Showing nodes accounting for 25, 100% of 25 total
Showing top 10 nodes out of 97
      flat  flat%   sum%        cum   cum%
        23 92.00% 92.00%         23 92.00%  runtime.gopark
         1  4.00% 96.00%          1  4.00%  runtime.sigNoteSleep
         1  4.00%   100%          1  4.00%  runtime/pprof.runtime_goroutineProfileWithLabels
         0     0%   100%          3 12.00%  bufio.(*Reader).Peek
         0     0%   100%          1  4.00%  bufio.(*Reader).Read
         0     0%   100%          2  8.00%  bufio.(*Reader).ReadByte
         0     0%   100%          5 20.00%  bufio.(*Reader).fill
         0     0%   100%          1  4.00%  bytes.(*Buffer).ReadFrom
         0     0%   100%          1  4.00%  crypto/tls.(*Conn).Read
         0     0%   100%          1  4.00%  crypto/tls.(*Conn).readFromUntil
We can use topN and sort with the -cum (for cumulative) flag:
(pprof) top10
(pprof) top5 -cum
with graphviz installed, we can generate a web repot
(pprof) web
to find out the functions that spend most of the time in mallocgc
(pprof) web mallocgc
Get a heap memory profile
go tool pprof http://localhost:8082/debug/pprof/heap
We can generate a PNG profile if we have the dot tool from
graphviz installed.
go tool pprof -png http://localhost:8082/debug/pprof/heap > pprof-heap.png
CPU profile
go tool pprof http://localhost:8082/debug/pprof/profile
(pprof) top
Showing nodes accounting for 150ms, 100% of 150ms total
Showing top 10 nodes out of 99
      flat  flat%   sum%        cum   cum%
      80ms 53.33% 53.33%       80ms 53.33%  runtime.cgocall
      30ms 20.00% 73.33%       30ms 20.00%  syscall.syscall
      10ms  6.67% 80.00%       10ms  6.67%  google.golang.org/protobuf/internal/encoding/json.(*Decoder).parseNext
      10ms  6.67% 86.67%       10ms  6.67%  runtime.madvise
      10ms  6.67% 93.33%       10ms  6.67%  runtime.mallocgc
      10ms  6.67%   100%       10ms  6.67%  runtime.netpoll
         0     0%   100%       10ms  6.67%  bufio.(*Reader).Read
         0     0%   100%       10ms  6.67%  bufio.(*Reader).ReadByte
         0     0%   100%       10ms  6.67%  bufio.(*Reader).fill
         0     0%   100%       20ms 13.33%  bufio.(*Writer).Flush
Note: the trace endpoint (/debug/pprof/trace?seconds=5), outputs a file
that is not a pprof profile but a trace that we can view using go tool trace.
For goroutine blocking and to see the holders of contended mutexex, we need to call runtime.SetBlockProfileRate and runtime.SetMutexProfileFraction in the program:
runtime.SetBlockProfileRate(1)
runtime.SetMutexProfileFraction(1)
go tool pprof http://localhost:8082/debug/pprof/block
go tool pprof http://localhost:8082/debug/pprof/mutex
Allocated and In-Use memory
we can view either allocation or in-use memory. When we’re concerned with the amount of memory being used, chose the ‘inuse’ metrics, if we’re concerned with time spend in garbage collection, view allocations
-inuse_space      Display in-use memory size
-inuse_objects    Display in-use object counts
-alloc_space      Display allocated memory size
-alloc_objects    Display allocated object counts
Last modified on Sunday, Mar 27, 2022.
Go back